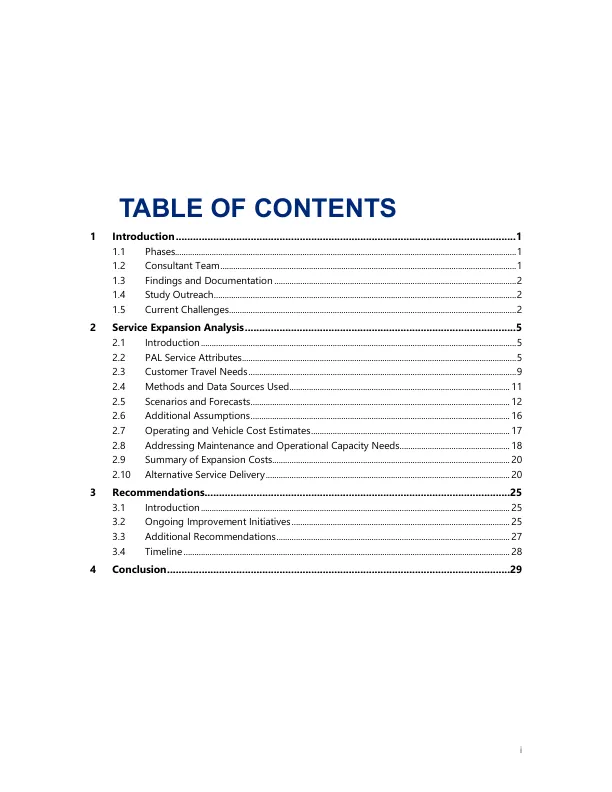
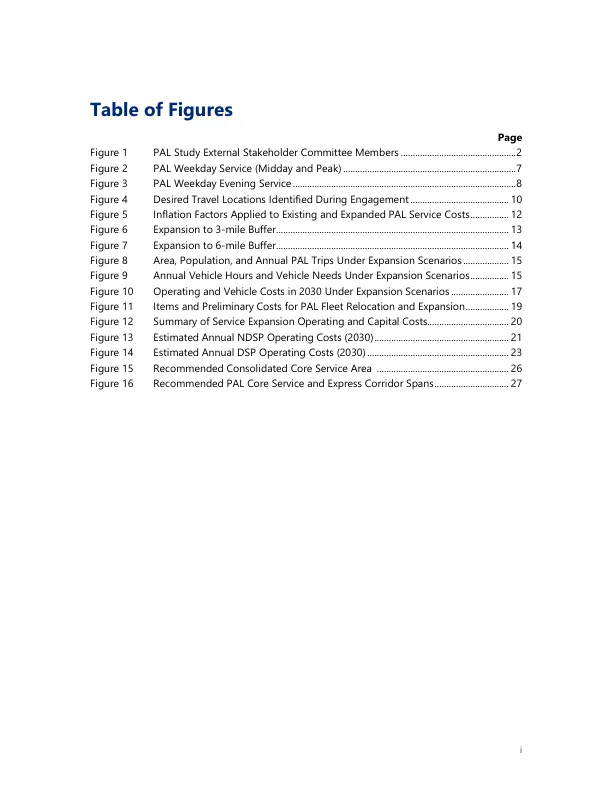
Page Figure 1 PAL Study External Stakeholder Committee Members ................................................ 2 Figure 2 PAL Weekday Service (Midday and Peak) ........................................................................ 7 Figure 3 PAL Weekday Evening Service ............................................................................................. 8 Figure 4 Desired Travel Locations Identified During Engagement ......................................... 10 Figure 5 Inflation Factors Applied to Existing and Expanded PAL Service Costs ................ 12 Figure 6 Expansion to 3-mile Buffer ................................................................................................. 13 Figure 7 Expansion to 6-mile Buffer ................................................................................................. 14 Figure 8 Area, Population, and Annual PAL Trips Under Expansion Scenarios ................... 15 Figure 9 Annual Vehicle Hours and Vehicle Needs Under Expansion Scenarios ................ 15 Figure 10 Operating and Vehicle Costs in 2030 Under Expansion Scenarios ........................ 17 Figure 11 Items and Preliminary Costs for PAL Fleet Relocation and Expansion .................. 19 Figure 12 Summary of Service Expansion Operating and Capital Costs.................................. 20 Figure 13 Estimated Annual NDSP Operating Costs (2030) ........................................................ 21 Figure 14 Estimated Annual DSP Operating Costs (2030) ........................................................... 23 Figure 15 Recommended Consolidated Core Service Area ....................................................... 26 Figure 16 Recommended PAL Core Service and Express Corridor Spans ............................... 27
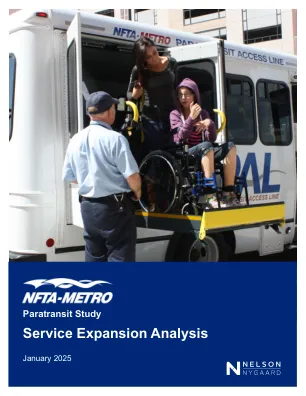
服务扩展分析-NFTA Metro | paratransit研究
